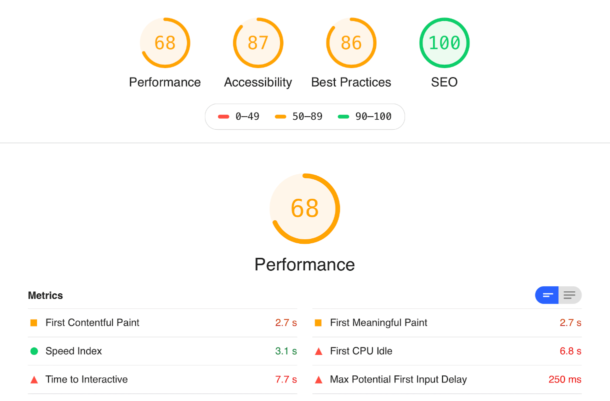
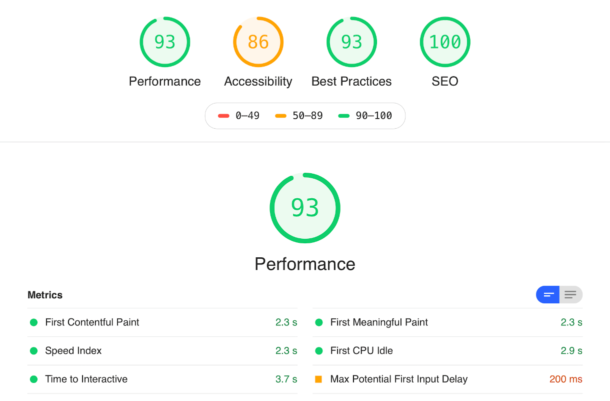
Earlier this year, our design team spent a few weeks analyzing and improving the performance of the Postmark product website. Our app is known for lightning-fast email delivery, and we wanted to provide a similar experience to the visitors of the website. Conveniently, what’s good for people is also good for robots — search engines increasingly use performance and user experience metrics as a ranking factor in search results. Once completed, this project made the Postmark site significantly faster and increased our Lighthouse Performance score from 68 to a perfect 100.
Web performance problems often creep in unnoticed. We do our best to keep regressions in check, but the nature of releasing something new often works against us. Every change or improvement comes with an increase in size for web assets and a slightly longer loading time. That’s why stepping back to evaluate the bigger picture can provide unexpected insights and discoveries.
The scope of this project was more in line with fixing a few leaky pipes and removing junk than remodeling the whole house or starting new construction. We are still happy with the choice of Craft CMS for our product sites, but it was time to update our DigitalOcean infrastructure and cut some fat from the frontend. Performance improvements often come not from adding the latest and greatest technology, but from showing restraint and removing nice but unnecessary things (very stoic!)
Project #1: The Fake Widget
We started our investigation of the frontend by looking at a timeline of our network requests. The server responded in a reasonable time and pages rendered without major issues, but we observed that resources continued loading in the background for a while. All of these slow-loading assets were from third parties, like web analytics, marketing services, support widgets, etc. After temporarily removing them, the total loading time and Time to Interactive (TTI) decreased by 3x!
How important is TTI? While Time to Interactive is not as critical as perceived loading speed, which is typically measured by First Contentful Paint (FCP) or Largest Contentful Paint (LCP), it keeps the CPU busy and shows the browser’s loading indicator. An argument can even be made that despite its name, in our case, TTI didn’t prevent users from interacting with the page as third party scripts don’t show their UI until fully loaded. Still, we had an easy-to-try idea that could improve both total loading time and TTI.
It wasn’t possible to remove the third party scripts that were responsible for collecting business data, but it was possible to experiment with how the Help Scout chat widget loads on the page. It’s used only occasionally by customers, but always preloads assets for displaying the support window. In total, it makes 16 requests, transferring 576 KB of assets, including a few webfonts and a copy of React. That’s more than our whole home page!
What if we could replace the real widget, which appears as an icon with some text, with a fake replica that loads the real thing after a click?

This solution is not unique to Help Scout and can be used with any other support or live chat widget. According to the article “How do different chat widgets impact site performance?”, most of them markedly affect performance, and their users (and their users’ customers!) may benefit from this approach.
The solution is an imitation of the original button that looks just like the Help Scout Beacon with our HTML and CSS. When the user clicks it, the fake button hides and loads the original JS from Help Scout — along with everything else. The cookie is set when the widget is opened, so the fake widget is skipped and the real widget is opened immediately if the user navigates to a different page in the middle of a chat.
var FakeBeacon = {
  init: function() {
    document.querySelector('.js-beacon').addEventListener('click', function() {
      FakeBeacon.load(this);
    });
  },

  load: function(el) {
    // Trigger beacon loading
    FakeBeacon.loadScript();

    // Indicate that it's loading
    el.classList.add('is-loading');

    // Once loaded, hide the fake beacon and open the real one
    window.Beacon('once', 'ready', function() {
      el.remove();
      window.Beacon('open');
      Cookies.set('hs-beacon', 'open', { expires: 1 });
    });

    // Once real beacon is closed, revert to the normal behavior
    window.Beacon('on', 'close', function() {
      Cookies.remove('hs-beacon');
    });
  },

  loadScript: function() {
    // Help Scout's original loading code
  }
}
This approach has only two downsides, neither of which was important to us when considering the tradeoffs for increased performance:
- Opening the support widget takes a few seconds, since it must load assets after the visitor clicks. We incorporated a spinner to indicate loading progress and provide feedback to the user.
- Our Customer Success team can no longer see previously visited pages in Beacon’s History. They are recorded when the widget is fully loaded, which now happens only when the user opens it. This aspect could be important to some support teams but was a worthy tradeoff for us.
This change only took a couple days to build and increased our Lighthouse Performance score from 68 to 93, Best Practices score from 86 to 93, and reduced Time to Interactive from 7.7s to 3.7s. The Pareto principle states that roughly 80% of the effects come from 20% of the causes, and this is very true in this case.
Project #2: Server Environment
While I was investigating the frontend, Derek Rushforth took care of our backend. Our DigitalOcean droplet was getting old, and we started experiencing issues. Craft CMS couldn’t be updated to the latest version because we were on an older version of PHP. The issues cascaded from there: PHP couldn’t be updated because we were on an older version of our OS. The OS could be updated, but DigitalOcean recommends starting with a new droplet instead.
At Wildbit, the design team is responsible for running our marketing site and landing pages. By configuring servers and managing droplets, we get ultimate control over our setup, but it also takes time and effort. Derek investigated alternatives and tried a managed Craft service from Hyperlane, but the performance was worse than on our old droplet for a much higher price. In the end, he automated infrastructure provisioning with Terraform and built a new environment on DigitalOcean. Our MySQL database was also moved to a separately managed instance, and a Redis instance was built for caching Craft requests. This provided a lot more stability than what we had before.
Ultimately, a new environment reduced our Time to First Byte by 50-150 ms, and now it’s generally in the 200-300 ms range. We didn’t record how it affected the Lighthouse Performance score, but our First Byte Time score in WebPageTest went from B to A.
Project #3: Everything Else
This part involved a bunch of experiments and minor improvements:
- Removed a Twitter widget from the blog. The widget allowed readers to follow our team members on Twitter without leaving the page, but that functionality didn’t justify the tradeoffs in performance. Removing the widget increased the Performance score of our blog posts by 4 points.
- Our CSS was 67.7 KB gzipped. Based on Google Analytics, I broke it down into four bundles: core (used on all pages), the home page, blog, and everything else. The resulting CSS was a 3x reduction for the majority of our visitors.
- Disabled inlining small images into CSS. The bundle was getting too big, and Base64 is not gzip-friendly.
- Removed a couple of webfonts that were used only in a few places. One font was from TypeKit, so we sent a request even when the font wasn’t used on the page. That left us with a single webfont used on every page, and we now preload it ahead of time.
- Finally, we removed and refactored some legacy CSS.
These changes increased our Performance score from an already respectable 93 to a great 97. On the most important pages, First Contentful Paint (FCP) improved from ~2.3s to ~1.2s.
The Result
Here is what we started with:

By introducing the fake chat widget, we dramatically improved the overall result and decreased Time to Interactive and First CPU Idle. Other metrics had a smaller improvement as well.

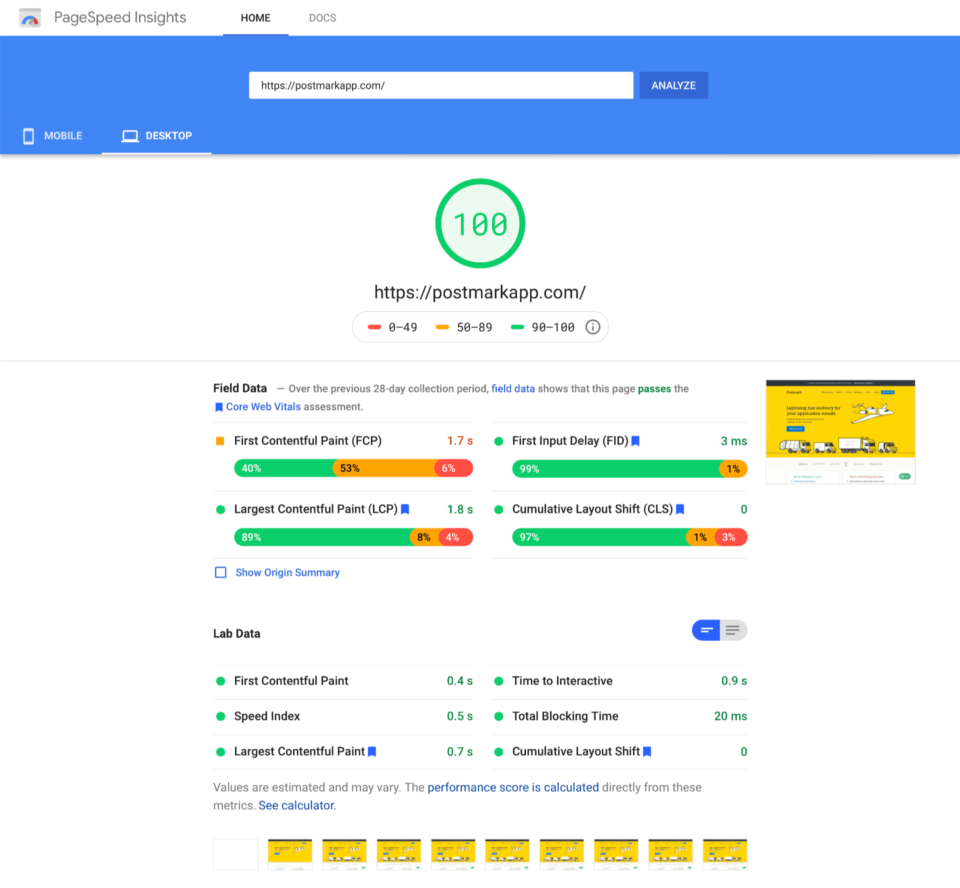
Improvements to the server infrastructure reduced our Time To First Byte (TTFB), which along with miscellaneous frontend updates, helped improve our First Contentful Paint (FCP) from ~2.3s to ~1.2s at the moment of testing. That brought our Performance score to a perfect 100.
Because testing in Chrome’s Developer Tools can be affected by the tester’s internet connection speed and performance of their computer, I confirmed the results in Google’s PageSpeed Insights.

(The vast majority of our website visitors use desktop computers, but we plan to work on improving a Mobile score as well in the future.)
As I mentioned in the beginning, better performance improves the experience for users of our site and improves search engine rankings. Google will also be incorporating Core Web Vitals as one of their ranking signals in the future. Our desktop metrics in Google Search Console already looked good, but the number of pages “needing improvement” on mobile drastically decreased after finishing this project:

In total, Derek and I spent about 2.5-3 weeks optimizing the frontend and rebuilding servers. Considering we work 4-day weeks at Wildbit, the whole project took about 20 development days.
Our entire team is happy with the outcome, and we hope our customers will feel the difference, even if they couldn’t point to what exactly changed.

